|
Navigation: Toolboxes > Time Domain Toolbox > Variation Analysis |
  
|
Using the Monte Carlo analysis option of the Time Domain Toolbox, you can perform a predefined number of simulation runs with variation of parameter values according to a predefined distribution function. We will then
restrict the parameter variation until the error is within certain bounds. This is called Variation analysis.
| 1. | From the Getting Started Manual\Time Domain Toolbox library open the model ParameterSweep. |
| 2. | Open the Simulator. |
| 3. | From the Tools menu select the Time Domain Toolbox and then Variation Analysis. |
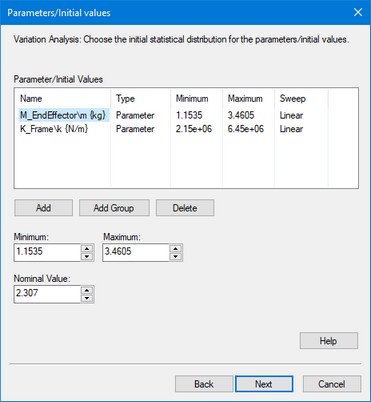
A window opens asking you which parameters / initial values should be varied for the Variation analysis:
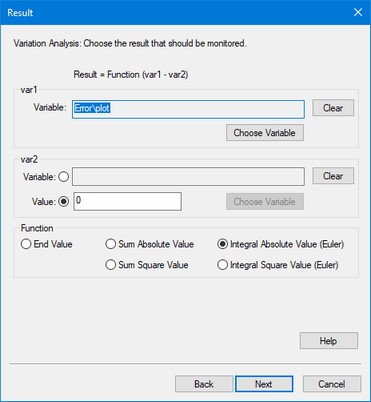
Here the integrated absolute error of the machine is chosen.
| 5. | Click the Next button. |
A window opens asking you which result should be monitored during the Variation Analysis:
Two parameters have already been entered.
| 6. | Click the Next button. |
A window opens asking some simulation run options:
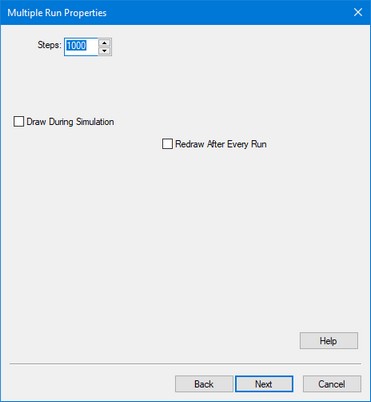
Because this is a statistical method, we have to do many simulations runs. We therefore choose not to display the results in a plot to speed up simulation and prevent using too much computer memory.
| 6. | click the Next button. |
A window opens with a summary of the chosen options. If your are not satisfied you can use the Back button to go to a previous window and change settings.
| 7. | Click the Finish button to close the Multiple Run Wizard. |
| 8. | From the Simulation menu click the Multiple Run command to perform the Variation Analysis. |
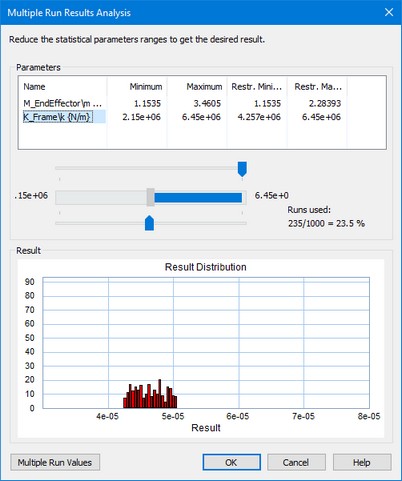
After simulation has been done, a Variation Analysis Results window will open, showing the results. A histogram shows the distribution of the result. Using the slider bar you can see how restraining the distribution of the parameters effects the distribution of the result.

The histogram shows the value of the integrated absolute error on the x-axis and the number of runs on the y-axis.
You can select the following items:
| • | Slider Bar: Select a parameter and restrict its distribution with the slider bar. You will see the results distribution change. |
| • | Multiple Run Values: Choose this button to open the list that shows the output of the various runs performed during the Variation Analysis. |
| • | OK: Close the Multiple Run Results Window. |
You can always re-open the Multiple Run Results window, by selecting the Multiple Run Results command of the View Menu.
| 9. | Change the slider bar for the two parameters and inspect the results. |
You can see the following:
| • | An increase of the end effector mass will not reduce the maximum error. |
| • | A decrease of the stiffness will not reduce the maximum error. |
We can slide the maximum mass to the middle and minimum stiffness to the middle to decrease the error: