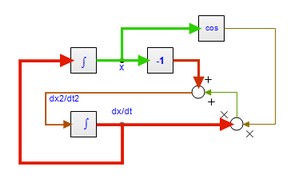
To Animate the results of a simulation in the graphical model select the Graph Animation command from the Tools menu (Simulator). During simulation, the thickness and color of bonds and signals will correspond with the values they carry.
The color of a bond or signal always corresponds with the sign, red for negative values and green for positive values. The thickness of signals corresponds with the value. For signals that is obvious but for bonds or connections carry two variables: effort and flow (also know as across and through). For bonds and connections you can choose to let the thickness correspond with the effort, flow or power (effort*flow), depending on the Animation command that was chosen.

You can start Animation in the Simulator:
| 1. | Run a simulation until you are satisfied with the results. |
| 2. | From the Tools menu, select Animation Toolbox then Graph Animation. |
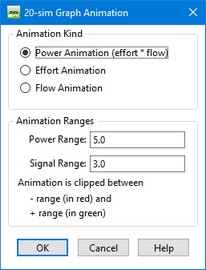
| 3. | A menu pops up. Choose the options you like and click OK to start Animation. |

| • | Animation Kind: For signals, the thickness always corresponds with their value. For bonds and connections you can choose. Select here to what the thickness of bonds and connections should represent: effort, flow or power (effort*flow). |
| • | Animation Ranges: The thickness of bonds and signals can vary from 1 to 5 pixels. Select here the range that should correspond with a thickness of 5 pixels. |


