


|
Navigation: Toolboxes > Time Domain Toolbox > Sensitivity Analysis |
  
|
Using the Sensitivity Analysis option of the Time Domain Toolbox, you can detect which variations in parameter values will give the largest deviation of a given metric. If, for example, the metric is the accuracy of a machine, with sensitivity analysis you can detect how sensitive the machine is for parameter changes, with respect to that accuracy.
Sensitivity analysis starts with a simulation run with nominal parameter values. After the run a given result is monitored (r). Then, one by one, each parameter (pi) is changed with a given percentage (to pi + dpi) and a simulation run is performed. After the simulation run the changed result is monitored (r + dri). After all the runs, the results are displayed as sensitivities, where sensitivity is defined as the change in result divided by the change in parameter:
Si = dri / dpi
A large sensitivity means that the result is highly dependent of the parameter value. This can be used for optimization (change the parameter value) or design (change the design to make it less dependant of the parameter).
| 1. | From the Getting Started Manual\Time Domain Toolbox library open the model SensitivityAnalysis. |
| 2. | Open the Simulator. |
| 3. | From the Tools menu select the Time Domain Toolbox and then Sensitivity Analysis. |
A window opens asking you which parameters / initial values should be changed for the sensitivity analysis:
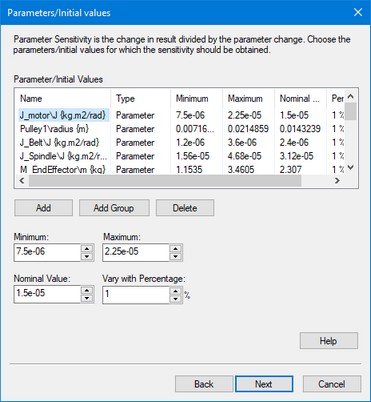
As you can see the parameters have already been entered.
| 4. | Click the Next button. |
A window opens asking you which result should be monitored for the sensitivity:
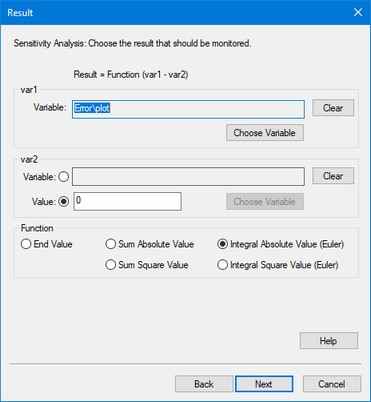
The integral absolute value of the position error is chosen here.
| 5. | Click the Next button. |
A window opens asking some simulation run options:
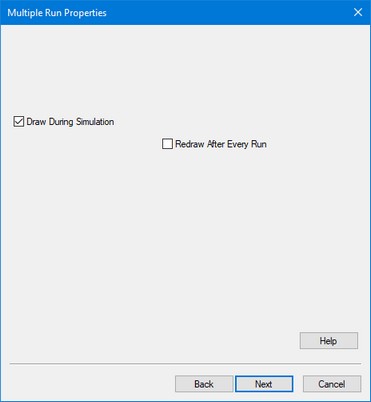
| 6. | Click the Next button. |
A window opens with a summary of the chosen options. If your are not satisfied you can use the Back button to go to a previous window and change settings.
| 7. | Click the Finish button to close the Multiple Run Wizard. |
| 8. | From the Simulation menu click the Multiple Run command to perform the Sensitivity Analysis. |
Now the Simulator will perform a number of simulation runs and show the results.
After simulation has been done, a Sensitivity Analysis Results window will open, showing the sensitivities:

As you can see, a change in pulley2 radius will by far give the largest change in error. I.e. the system is very sensitive to changes in the pulley2 radius. You can select the following items:
| • | Multiple Run Values: Choose this button to open the list that shows the output of the various runs performed during the sensitivity analysis. |
| • | Close: Close the Sensitivity Analysis Results Window. |
You can always re-open the Multiple Run Results window, by selecting the Multiple Run Results command of the View Menu.