Next to time domain analysis through the standard time domain plots, 20-sim can also show results in the frequency domain through FFT analysis and Bode Plots. The picture below shows the various actions and resulting plots.
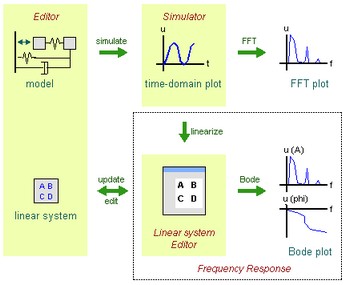
Bode plots originate from linear systems theory. A bode plot shows the amplitude and phase response (as a function of the frequency) of a linear system. In 20-sim linear systems can be derived in the Simulator out of any linear or non-linear model (model linearization). The resulting linear system is shown in the Linear System Editor. In this editor you can generate Bode plots. The generation of Bode plots can be automated in the Frequency Response dialog. In this dialog you can define the linearization settings and desired linearization output (Linear System Editor or Bode plot).
Procedure
| 1. | Select the Frequency Response from the command from the Properties menu. |
| 2. | Enter your options in the Frequency Response Dialog. |
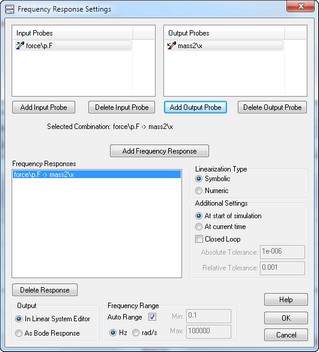
The Frequency Response dialog.
Items
| • | Input Probes: Enter possible input signals for linearization here. |
| • | Output Probes: Enter possible output signals for linearization here. |
| • | Frequency Response: With the Add Frequency Response you can add new input/output pairs. For every input/output pair linearization will be performed with a corresponding linear system as result. |
| • | Symbolic/Numeric: Select the desired linearization method. |
| • | Closed Loop: By default all linearization is open loop. Select the Closed Loop option to preform closed loop linearization. |
| • | At start of simulation/At current time: Select the time of the linearization. |
| • | Output: Select the desired output of the linearization. |
| • | Frequency Range: Select the desired frequency range. |
| • | OK: click the OK button to close the dialog. |


