The Plot Properties Editor can be used to enter the plot specifications. To open the Plot Properties Editor, you have to:
| 1. | From the Properties menu select the Plot command. |
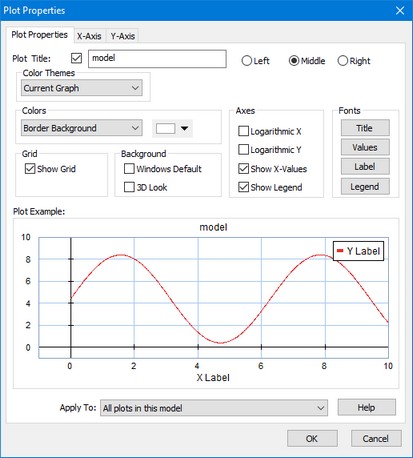
The Plot Properties Editor.
The editor shows three tabs which can be used to set the properties of the plot and the x and y variables.
Plot Properties Tab
The Plot Properties Tab shows the general settings that accompany a plot. A preview is shown in the lower part of the tab.
| • | Plot Title: Select this option to add a title to the plot. In the text box you can type the desired title. Use the radio buttons to display the title to the left, in the middle or to the right of the plot. |
| • | Color Themes: Use this option to select a different theme for the plot. |
| • | Colors: Click the drop down list and choose the colors for the various plot options. |
| • | Grid: Select this option to show the grid. |
| • | Windows Default: Select this option to get the default Windows background. |
| • | 3D Look: Select this option to get a plot with 3D Look (sunken edges). |
| • | Select the options Logarithmic X and Logarithmic Y to show logarithmic plots. |
| • | Show X-Values: Use this option to show or hide the X-axis values. |
| • | Show Legend: Use this option to show to show a legend. |
| • | Fonts: Click the Title, Values and Labels buttons to select the font options for the title, values and labels. |
| • | Apply To: You can select here to apply the changes to: 1) All plots in the model, 2) Al plots in the window, 3) only this plot or 4) Set it as default for all future plots. |
X-Axis Tab
The X-Axis Tab can be used to specify the variable plotted along the X-axis.
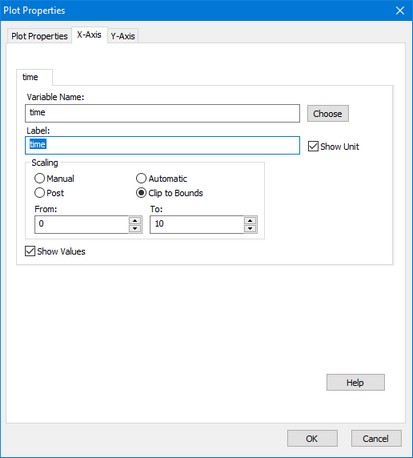
The X-Axis tab of the Plot Properties Editor.
| • | Variable Name: The time, a variable or a parameter can be chosen as the X-axis variable. Click the button on the right (Choose) to open the Variable Chooser and select the desired variable or parameter. You can also type the variable name directly. |
| • | Label: Enter the label that should be printed below the X-axis. |
| • | Show Unit: Select this option to display the unit of the chosen variable. |
| • | Manual: Fix the scale of the X-axis by selecting a minimum and maximum value in the From and To boxes. |
| • | Post: During the simulation run, the scale for the variable along the axis is fixed. When the run is finished or has been interrupted by the user, the minimal and maximal scale values are automatically updated and the plot is redrawn to make sure all calculated points are displayed. |
| • | Automatic: When a variable reaches the end of the scale, during simulation, the the minimal and maximal scale values are automatically updated and the plot is redrawn to make sure all calculated points are displayed. |
| • | Clip to Bounds: When a variable reaches the end of the scale, during simulation, the the minimal and maximal scale values are automatically updated and the plot is redrawn to make sure all calculated points are displayed. When the run is finished or has been interrupted by the user, the minimal and maximal scale values are automatically updated to show the plot at maximum scope. |
| • | Show Values: Use this option to show or hide the X-axis values. |
Y-Axis Tab
The Y-Axis Tab is used to specify the curves that should be shown in the plot. For each selected curve, a tab is shown, displaying the settings of that curve.
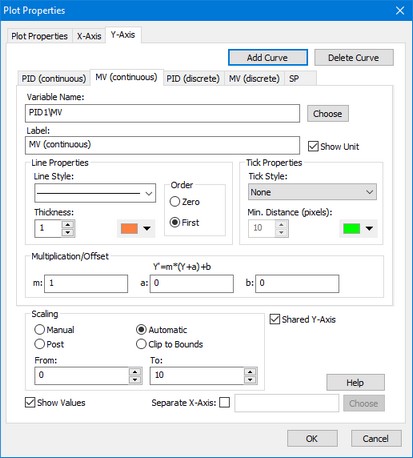
The Y-Axis tab of the Plot Properties Editor.
Curves
| • | Add Curve: Add a new tab to specify a new curve to be displayed in the plot. |
| • | Delete Curve: Delete the selected tab. As a result, the curve specified in the tab will not be displayed in the plot, and the settings are lost. |
| • | Variable Name: Use this box to connect a variable to a curve. One of the dynamic variables of the model can be selected or a parameter. Click the button on the right (Choose) to open the Variable Chooser and select the desired variable or parameter. You can also type the variable name directly. |
| • | Label: Enter the name of the curve. This label is also printed next to the the Y-axis. |
| • | Show Unit: Select this option to display the unit of the chosen variable. |
| • | Line Style: Select the desired line style of the curve. |
| • | Thickness: Select the desired line thickness of the curve. You can set the default line thickness in the General Properties dialog. |
| • | Color: Select the desired line color of the curve. |
| • | Order: In the plot a line is drawn from plot point to plot point. You can choose the line to be of two orders of interpolation: |
| • | Zero: the line consists only of horizontal and vertical parts. |
| • | First: the line consists of straight parts. |
| • | Tick Style: Each calculated point of a curve, can be displayed by a special marker. Select here the desired marker. |
| • | Min. Distance (pixels): To prevent markers from being drawn on top of each other, you can set the minimum distance between markers. Points that are to close to a previous marker are not drawn with a marker. |
| • | Color: Select the marker. |
| • | Multiplication/Offset: add an optional scaling and offset to the selected variable before displaying in the plot |
| • | m: scale (multiply) the selected variable with this value before plotting. |
| • | a: Y-axis offset before scaling |
| • | b: Y-axis offset after scaling |
| • | Scaling: Scaling can be selected for each curve individually or combined for all curves. |
| • | Shared Y Axes: Select this option to use one Y-axis scale for all curves. |
| • | Manual: Fix the scale of the variable by selecting a minimum and maximum value in the From and To boxes. |
| • | Post: During the simulation run, the scale for the variable along the axis is fixed. When the run is finished or has been interrupted by the user, the minimal and maximal scale values are automatically updated and the plot is redrawn to make sure all calculated points are displayed. |
| • | Automatic: When a variable reaches the end of the scale, during simulation, the the minimal and maximal scale values are automatically updated and the plot is redrawn to make sure all calculated points are displayed. |
| • | Clip to Bounds: When a variable reaches the end of the scale, during simulation, the the minimal and maximal scale values are automatically updated and the plot is redrawn to make sure all calculated points are displayed. When the run is finished or has been interrupted by the user, the minimal and maximal scale values are automatically updated to show the plot at maximum scope. |
| • | Show Values: Select or de-select this option to show or hide the name and scale of a curve. |
| • | Separate X-Axis: If you want another x-axis than specified in the X-axis tab, click the Choose button to select the desired variable. |


