


|
Navigation: Editor > Introduction > Graphical Editor Taskbar and View menu |
  
|
When you view or enter a graphical model in 20-sim it is shown in the Graphical Editor. A special button bar, called the taskbar, is part of the Graphical Editor. The taskbar helps you to select models, connect them and manipulate them. You can also use the taskbar to enter drawing objects. The taskbar is also part of the Icon Editor.
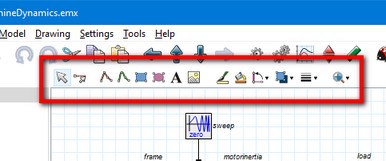
The taskbar of the Graphical Editor.
|
Selection Mode: Click this button to select models and objects |
|
Insert Terminals: (Icon Editor only) Click this button to insert terminals. |
|
Connection Mode: (Graphical Editor only) Click this button create connections between models. |
|
Line: Click this button to draw lines. |
|
Spline: click this button to draw splines. |
|
Rectangle: click this button to draw rectangles. |
|
Ellipse: click this button to draw ellipses. |
|
Text: click this button insert text. |
|
Bitmap: click this button insert bitmaps and images in svg format. |
|
Line Color: click this button to set the line color of a selected object. |
|
Fill Color: click this button to set the fill color of a selected object. |
|
Rotate and Mirror: click this button to rotate or mirror a selected object. |
|
Arrange and Group: click this button to group objects, put them to the front etc. |
|
Line Styles: click this button to select the line style of selected objects. |
|
Zoom: click this button to select the zoom factor. You can also click Ctrl + mouse wheel to zoom in and out. |
View Menu
| • | Choose Colors: Choose the line color, text color color and shadow color of selected items in the model. |
| • | Show Name: Show the submodel name right,left, top down or hide. |
| • | Port Names: Show the port names of the submodels |
| • | Causality Info: Show the causality of the iconic diagram and bond graph connections. |
| • | Orientation Info: Show the orientation of the connections. |
| • | Show Terminals: Show the terminals of the models. With the Show Terminals option selected, you can change the location and properties of the terminals directly in the Editor (no need to open the Icon Editor). |