


|
Navigation: Editor > Using Models > Analyze Causality |
  
|
Causal analysis is the procedure to get the model equations correct form. For Bond Graph models this means that the direction of the efforts and flows of the bonds have to be determined. The result of the analysis is displayed by causal strokes (denoted by |). For Iconic Diagrams this means that the direction of the across and through variables of the connections have to be determined. The result of the analysis is displayed by causal arrows (denoted by -> ).
To perform causal analysis you have to:
| 1. | From the Model menu select the Analyze Causality command. Now causality will be assigned in the complete model. |
Bond Graphs
| • | Causal strokes are shown in Bond Graphs automatically. |
| • | Setting Causality can also be done by hand. Just select a bond and choose Properties from the right mouse menu. A menu pops up in which you can set causality by hand. The corresponding causal stroke is displayed in green (denoted by |). |
User defined causality (denoted by |).
| • | If 20-sim fails to perform a causal analysis of the model (a causal conflict), the corresponding bond is displayed red. |
![]()
A causal conflict (denoted by the red bond).
| • | Some submodels have a preferred causality. If assignment of the preferred causality is not possible (because of other constraints), the corresponding causal stroke is displayed in orange (denoted by |). |
![]()
Preferred causality not assigned (denoted by |).
| • | To see the order in which automatic causality assignment has been performed, choose Causality Info from the View menu. |
Iconic Diagrams
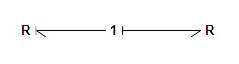
| • | Causality in Iconic Diagrams is only shown when you select the Causality Info command of the View Menu. |
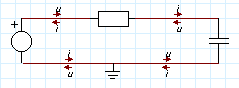
Causal Information shown by arrows.
| • | If 20-sim fails to perform a causal analysis of the model (a causal conflict), the corresponding connection is displayed red. |