


|
Navigation: Toolboxes > Control Toolbox > Controller Design Editor > Step Response |
  
|
The Step Response command calculates the systems response y on a unit step input:
u = 0 (time < 0 )
u = 1 (time >= 0 )
20-sim automatically generates an appropriate range for the time response, based on the system dynamics. With the Plot Properties command (right mouse menu), you can change this horizon and recalculate the step response (click the Step command again).
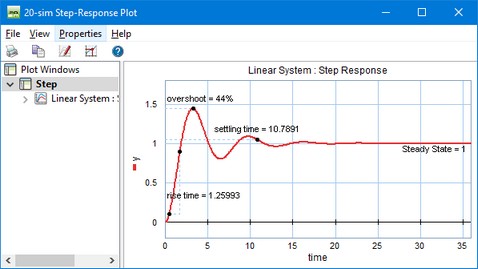
Using the right mouse menu, you can use several options:
| • | Plot Properties: Set the general plot properties for the step response and specify the curve properties. |
| • | Numerical Values: Inspect numerical values. |
| • | Step Characteristics: Display rise time, overshoot, settling time and the steady state value of the step response. |
| • | Copy to Clipboard: Copy the plot to the windows clipboard. |
| • | Print: Print the plot. |
| • | Zoom in: Show a detail of the plot. |
| • | Zoom out: Show a larger portion of the plot. |
| • | Zoom Normal: Show the complete plot. |