Toolboxes > Mechatronics Toolbox > Servo Motor Editor > Theory > Torque Speed Plot
If we combine the results of the previous sections, a torque speed plot results as shown below. The arrows indicate the load curve with the circle as point of maximum load power. The Safe Operating Area shows the limits of operation due to motor specific parameters such as the maximum torque and speed.
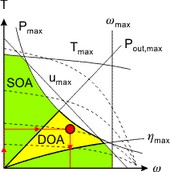
The lines of maximum output power and maximum efficiency are the edges of the Desired Operating Area.The procedure for choosing a proper motor is:
| 1. | Determine the load curve and the point of maximum load power. |
| 2. | Determine the duty cycle d (the percentage of the time that torque is required) and estimate the corresponding Td line with help of the shown T100, T50 , T25 and T10 lines. |
| 3. | Select a motor such that the following demands are satisfied: |
| • | The load curve is completely beneath the Td line (no overheating). |
| • | The point of maximum load power is as close to maximum voltage line as possible (we want to choose the smallest motor that can do the job). |


