The Pole Zero command plot the poles and zeros of a system and computes the root locus plot.
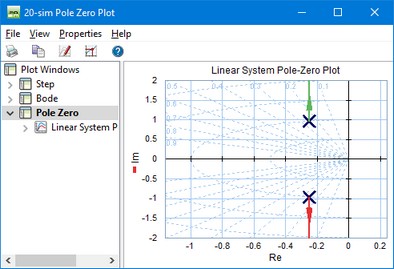
20-sim automatically generates a range of real and imaginary parts, based on the system dynamics. With the Plot Properties command (right mouse menu), you can change this horizon and recalculate the pole zero diagram (click the Pole Zero command again).
Root Locus
You can show the rootlocus plot by selecting Root Locus from the right mouse menu. Inspect the root locus gain by selecting Numerical Values from the right mouse menu.
Plot Options
Using the right mouse menu, you can use several options:
| • | Plot Properties: Set the plot properties. |
| • | Numerical Values: Inspect numerical values. |
| • | Root Locus: Show or hide the root locus plot. |
| • | Copy to Clipboard: Copy the plot to the windows clipboard. |
| • | Zoom in: Show a detail of the plot. |
| • | Zoom out: Show a larger portion of the plot. |
| • | Zoom Normal: Show the complete plot. |


