


|
Navigation: Modeling Tutorial > Bond Graphs > Bond Graphs |
  
|
Bond graphs are a network-like description of physical systems in terms of ideal physical processes. With the bond graph method we split up the system characteristics into an (imaginary) set of separate elements. Each element describes an idealized physical process. To facilitate drawing of bond graphs, the common elements are denoted by special symbols.
Look again at the car suspension example. In the picture below at the right a bond graph is shown that has been entered in 20-sim. All elements of the ideal physical model have corresponding elements in the bond graph. The connections between the elements in the bond graph, which are known as bonds, represent ideal energy transfer between the elements, i.e. no energy is stored, generated or dissipated. Bonds are drawn with harpoons (the half arrows).
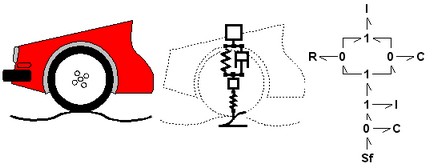
The car suspension model (middle) and corresponding bond graph model (right).
For the mechanical domain, ideal velocity sources are in bond graphs denoted by the symbol Sf. Dampers are denoted by an R, springs by a C and masses by a I. With a 1 a structural connection of elements is denoted and with a 0 a velocity difference is denoted.
A bond graph describes a physical system as a number of physical concepts (the elements) connected by energy flows (the bonds).