Bond Graphs
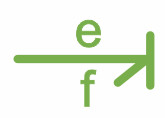
20-sim was the first commercially released software package to support bond graph modeling. The first version of 20-sim was released in 1995. Since then a continuous effort to improve bond graph modeling has made 20-sim the number one software package for bond graph modeling. Bond graphs are a network-like description of physical systems in terms of ideal physical processes. With the bond graph method, the system characteristics are split-up into an (imaginary) set of separate elements. Each element describes an idealized physical process. To facilitate drawing of bond graphs, the common elements are denoted by special symbols.
Library
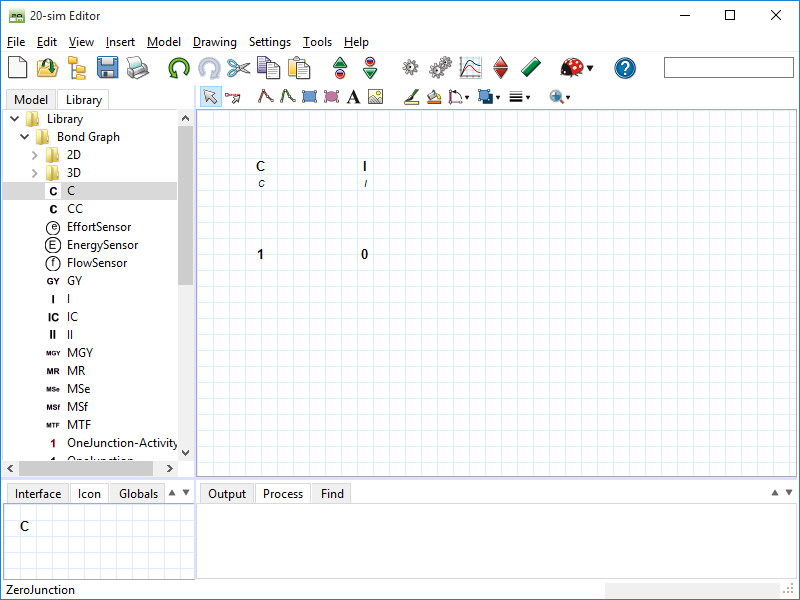
20-sim has a large library containing all standard bond graph elements. Next to standard elements 20-sim supports custom user made bond graph models.

Ports and Multiports
The foundation of bond graph modeling is the use of ports. 20-sim allows you to create user defined models with an arbitrary number of power ports and signals. Ports sizes can be 1 (default) or larger (multiports). For every port you can specify the causality as fixed preferred, indifferent or depending on the causality of other ports.
Causality
Causal strokes indicate the direction of the efforts and flows in a bond graph model. In 20-sim, you only have to enter the equations in one of the possible causal forms. If causality is changed, the equations are rewritten automatically. 20-sim shows causal strokes in black color for preferred causality and in causal strokes in orange color for non-preferred causality. The causality of a complete model is derived automatically but can be changed manually.
Algebraic Loops and Differential Causality
Algebraic loops and differential causalities are traced automatically. If possible, 20-sim will rewrite the equations symbolically to remove algebraic loops and differential causalities.
Custom Made Models
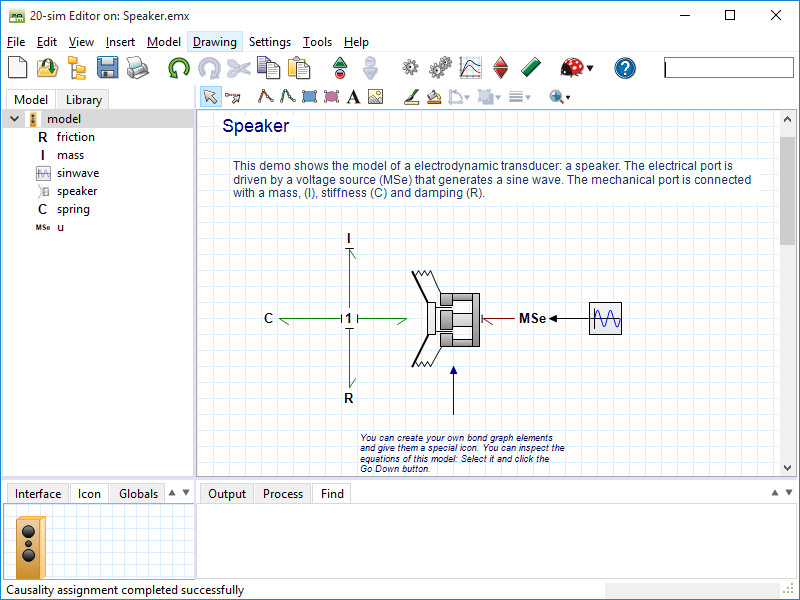
In 20-sim you can create your own bond graph models and save them in your own model library. Models can have an arbitrary number of ports, input and output signals. A specialized drawing editor can be used to give the models any kind of representation.

State Space
Any bond graph can be transformed automatically to a linear state space model. The result is shown in the Linear Systems Editor where you can show the resulting Bode Plot or export the state space model as a Matlab M-file or S-function. If the bond graph model contains non-linear elements, the transformation is performed using linearization in a user defined working point.
Read More
More information on bond graphs can be found in the blog section and in the 20-sim webhelp.