Run with Monitoring |
  
|
Run with Monitoring |
|
After configuring, connecting and compiling, you can run a model on the target. The variables (and parameters...) can be monitored in three ways:
•Monitoring in the variables view
•Monitoring in a real-time plot
•Monitoring in an oscilloscope view
When running the model on the target, all variables can be monitored (inspected) by opening a model node under Variables in the tree. For each model node in the tree the variable values are displayed as they change on the running target. Note that monitoring may not show all the samples since a limited refresh rate is used to prevent disturbing the running model.
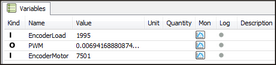
Variable inspection in the Variables view during run-time.
The second option is to view monitored values in a real-time plot (a live plot). First variables need to be selected for monitoring, see Select variables for logging and monitoring for more details. After variables have been selected, press the Monitor button ![]() on the action bar at the top of the 20-sim 4C windows. This will open real-time monitoring plot. The Monitor button can be pressed before the model is running and during run-time. When the model is already running, the monitor plot shows the variables from starting from the time you opened the monitoring plot. When the monitor plot is already open before running, it will plot the variables from the start. The picture below shows a sample of the real-time plot.
on the action bar at the top of the 20-sim 4C windows. This will open real-time monitoring plot. The Monitor button can be pressed before the model is running and during run-time. When the model is already running, the monitor plot shows the variables from starting from the time you opened the monitoring plot. When the monitor plot is already open before running, it will plot the variables from the start. The picture below shows a sample of the real-time plot.
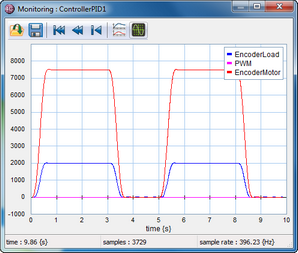
Click the Monitor button to open a plot showing the monitored variables.
By default, 20-sim 4C shows all monitor signals in one plot with a common Y-axis. This is not always convenient, e.g. when the scale of the monitored variables is different.
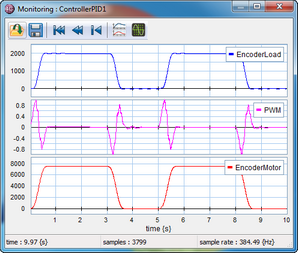
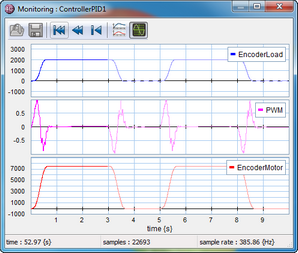
The same monitor plot with distributed curves.
You can use the Distribute curves button ![]() on the toolbar to give each monitored variable its own Y-axis:
on the toolbar to give each monitored variable its own Y-axis:
The monitor plot shows a signal from the start of the monitoring until the end of the model run. It is also possible to show only the recent history of the variables similar to an oscilloscope. Click on the Enable scope button ![]() to switch to the oscilloscope view. Enter the time base for the scope window, e.g. 10 s.
to switch to the oscilloscope view. Enter the time base for the scope window, e.g. 10 s.
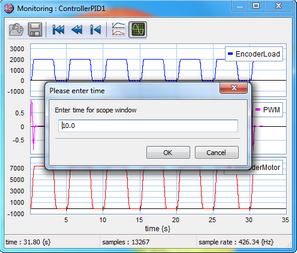
Enter time for scope window.
20-sim 4C will now only show a signal trace for a period of 10 s. The previous two traces are still visible but blended into the background.
Monitor plot in oscilloscope view.
Use one of the Clear buttons ![]() to clear older plots.
to clear older plots.